Pyxplot |
Examples - HR diagram |
Pyxplot is
sponsored and
hosted by

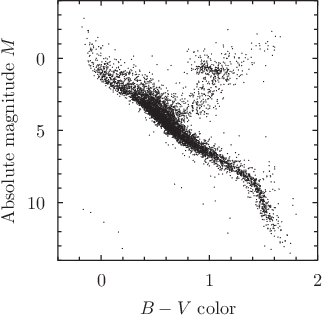
Using the dots plotting style to draw a Hertzsprung-Russell diagram This example uses the dots plotting style to plot data from a file which contains the colors and brightnesses of nearby stars, as measured by the European Space Agency's Hipparcos spacecraft. In the string d ps 3, the d is an abbreviation of dots, meanwhile ps is short for pointsize and sets the dots to be a size so that they show up clearly. The result is a Hertzsprung-Russell (HR) diagram, which is a scatter-plot that reveals that most normal stars lie along a tight line called the main sequence, whilst unusual classes of stars -- giants and dwarfs -- can be readily identified on account of their not lying along this main sequence. In the diagram above, five white dwarf stars can clearly be identified in the bottom left corner of the plot. Script
set nokey
set size square
set xlabel '$B-V$ color'
set ylabel 'Absolute magnitude $M$'
plot [-0.4:2][14:-4] 'hrdiagram.dat.gz' w d ps 3
|
